Trend pillar
The Token Ceiling
The internet's buildout had one curve to run — how many people signed up. This one has two, and the second is barely started. Every bubble argument is really an argument about the clock.
AI Data Centres: 46GW Announced Against About $100B in Annualised AI Sales Excluding China
Barclays counted the capacity in November 2025. Bloomberg reported the sales for Q1 2026. The unresolved variables are task intensity and timing.
The Thesis
Barclays counted 46GW of announced AI data-centre capacity in November 2025. Bloomberg reported $25B of global AI sales excluding China in Q1 2026. Annualising that quarter gives a derived run rate of roughly $100B a year.
SemiAnalysis estimated in August 2026 that SpaceX could use roughly 10GW to drive $300B of annual revenue run rate. Dividing $300B by 10GW gives a derived rate of $30B per GW per year. Applying that rate mechanically to Barclays’ 46GW gives $1.38T a year. That is 13.8 times Bloomberg’s Q1 2026 annualised sales figure.
This is a hurdle calculation. The records cover different scopes. Barclays counted announced industry capacity. SemiAnalysis modelled one operator. Bloomberg measured current global sales excluding China. The open variables are utilisation, compute consumed per task, realised revenue per unit of compute and the date demand arrives.
The Evidence
Start with the frame, because the frame is what changed.
Counting archive records whose headline or summary carries a given phrase, over the same Jan 1–Aug 28 window each year: “chatbot” appears in 211 records in 2023 and 195 in 2026. Four years, no compounding. “AI agent” appears in 4 records in 2023, 28 in 2024, 149 in 2025 and 465 in 2026. In 2023 the archive held one agent story for every fifty-three chatbot stories. Today it holds two and a half agent stories for every one.
The archive’s own volume nearly doubled across that span, so raw counts flatter every phrase. Normalised, the direction is the same and starker: per 1,000 archive records, chatbot mentions fell from 27 to 13 while agent mentions rose from 0.5 to 32. The chat frame did not merely stop growing. It halved as a share of what gets written about, in the four years everyone spent calling this the chatbot era.
Now the two curves, one at a time.
Curve one is late. ChatGPT reported 900M weekly active users in February 2026 and became the fastest app ever to 1B monthly users in June, with app MAUs up 62% year over year. Inside companies the number is further along: BCG data reported in July has 74% of front-line employees using AI regularly, against 51% a year earlier. Both are real growth. Neither can repeat. A number at 74% has one doubling left in it at most, and then arithmetic closes the door.
Curve two is early, and it is where the tokens are. Codex went from 1.6M weekly users in February to 5M+ by June, more than threefold from those reported endpoints in four months, and OpenAI’s own report on that milestone said the plain thing: knowledge workers were already about 20% of Codex users, and the tool had stopped being only a coding tool. Inside OpenAI, non-developer Codex use rose 137x for individuals while staff adoption went from roughly 40% to 97.9%. By July the combined Codex and ChatGPT Work figure was 10M people. Anthropic’s side of it runs the same way: Claude Code went from $1B of annualised revenue in November 2025 to $2.5B+ by February 2026, and by then was authoring 4% of public GitHub commits.
That is the mechanism worth holding on to. Coding is not the destination; it is the format. A machine that can observe, act and check its own work needs a shell, a file and a test to do it, so a legal review, a compliance escalation and a slide deck all arrive at the same execution surface a build does. Anthropic shipped ten agents aimed at financial firms in May — pitch decks, statement review, compliance triage. The seat-based software industry noticed before the market did: by the end of 2025, 79 of 500 software companies, more than double the year before. A vendor changes its unit of sale when its customers’ consumption stops tracking their headcount.
The revenue-per-app-user calculation has a scope limit. Bloomberg reported Anthropic’s annual revenue run rate at $65B by the end of July 2026, up from $4B in July 2025. Sensor Tower put Claude’s consumer-app audience at 56M monthly users in June 2026. Bloomberg said OpenAI was on track for more than $40B annualised in August 2026; Sensor Tower put ChatGPT at 1B consumer-app monthly users in June 2026. Dividing the company-wide run rates by those audiences gives a derived roughly $1,160 per Claude app user per year, against more than $40 per ChatGPT app user per year. These are mixed-date ratios, not measures of either app’s revenue or proof of what drives either company’s sales.
The arithmetic that has to close. Barclays counted 46GW of announced AI data-centre capacity in November 2025, and OpenAI alone had signed for 10GW by April 2026, three years ahead of its own target. In SemiAnalysis’s SpaceX model, roughly 10GW could support a $300B annual revenue run rate. That works out to a derived $30B per GW per year; the $/GW arithmetic is this site’s source of record. Apply that rate mechanically to Barclays’ announced 46GW and the result is $1.38T in annual revenue. Against it, the reported figure: global AI sales excluding China ran $25B in the first quarter, roughly $100B annualised, and that was reported as good news because it exceeded the estimated $21B of data-centre and chip depreciation in the same quarter.
The derived capacity model is 13.8 times the annualised sales receipt. SemiAnalysis modelled potential revenue for one operator; Bloomberg reported current sales across an industry excluding China. Neither record establishes when announced capacity will be used, or what customers will pay per unit of compute.
The counterweight is price. In one month, OpenAI cut GPT-5.6 Luna by about 80% after serving efficiencies, then cut Sol by more than 20% to $4 per million input tokens. It is also tuning the agent harness underneath Codex specifically to cut runaway token use. Every efficiency gain pulls twice: it makes the second curve affordable, and it means revenue only holds if volume climbs faster than price falls. Cheaper tokens are the reason intensity can grow, and the reason growing intensity does not automatically become growing revenue.
And the financing is dated even when the demand is not. Morgan Stanley expects AI-tied debt issuance near $570B, more than double the prior year, and has $1.5T of the $2.9T needed coming from outside the hyperscalers’ own cash. Lenders are stretching to underwrite to them. Bain’s estimate is that AI companies will need $2T of combined annual revenue and will fall about $800B short. A coupon has a date on it. A demand curve does not.
The Companies
Nvidia is where the second curve becomes a purchase order. In its August quarter it reported revenue up 106% to $96.22B with data centre up 117%, guided to $108B, and disclosed something more revealing than either: commitments to component suppliers of $279B, against $119B one quarter earlier and $50.3B three quarters before that. Those commitments are not a forecast of chip sales. They are a wager on token consumption two years out, placed with suppliers who need the order now.
Salesforce is the seat model meeting the meter. Alongside an August quarter with revenue up 11% to $11.35B, it unveiled Claudeforce with Anthropic — its data and workflows served inside Claude, starting with 37 prebuilt sales skills. The stock closed up 22.6%, its second-best day ever. That partnership put CRM workflows inside an external model interface. Salesforce’s September Koa announcement added an Agentforce route built on Nvidia’s Nemotron architecture. Whether either route trades a per-seat line for a per-token one is the open question its own dossier tracks.
SpaceX is the purest bet on curve two among listed names, and it prices it in public. Its August-reported quarter showed AI revenue up 247% to $2.56B year over year against $15.8B of AI capital spending in the same quarter — roughly six dollars out for every dollar in, deliberately. Then it closed a $60B acquisition of Cursor, buying the token consumer to sit on top of the compute it is building. The power wall is what decides whether the gigawatts behind that arrive on schedule; this page is about whether anything will be running on them.
The neoclouds — CoreWeave, Nebius, Applied Digital — are the leveraged expression of the same question, since their contracts are written against demand that has to show up on a lender’s schedule rather than a technologist’s. The capex supercycle tracks who is funding the build; the inference layer tracks who collects when the tokens flow; the chokepoint rotation tracks who keeps the dollar inside the machine itself. This page sits under all three, on the only quantity any of them depend on.
The Lenses
Ray Dalio’s debt-cycle template turns on a mismatch that has nothing to do with whether an investment is wise: debts are fixed obligations with dates attached, and the income meant to service them is not. A boom becomes a bust not when the underlying idea fails but when the cash flow arrives later than the schedule assumed. That is exactly the shape here. The demand argument in this record is strong and the demand timing argument is unresolved, and with $570B of AI-linked issuance the second one is the one that decides outcomes. Dalio’s framework does not ask whether tokens will be consumed. It asks whether they will be consumed before the interest comes due, which is a different question with a different answer.
Benjamin Graham’s margin-of-safety framework tests the gap between price and estimated value when inputs are uncertain. Barclays’ announced capacity, SemiAnalysis’s modelled operator revenue and Bloomberg’s current industry sales do not identify the year when capacity-backed revenue could catch up. Graham’s framework treats a wider price-to-estimated-value gap as necessary when that crossing year cannot be specified. Bloomberg reported Anthropic’s revenue run rate rising from $4B in July 2025 to $65B in July 2026, a derived sixteen-fold increase. That is one company’s growth, not a utilisation rate for Barclays’ announced capacity.
What Moved
The October 7 report puts a borrowing request beside the token-demand model. The Financial Times reported, citing sources, that SpaceX is seeking $40B to buy Nvidia chips: about $10B in bank loans and $30B in investment-grade debt, in a deal led by Apollo. That is financing sought, not debt issued or chips delivered. The proposed $40B is a derived 1.9 times SpaceX’s FY2025 capex of $20.9B in the DeadRisk market layer. That layer shows FY2025 free cash flow of negative $14.1B, against negative $5.4B in FY2024. Those full-year figures are not an AI-only ledger. They show the scale of the request against existing spending, not when the chips might earn revenue.
The customer ceiling arrived on September 29. The Information reported that Anthropic’s IPO prospectus lists agreements to pay SpaceX up to $84.5B for Nvidia-based compute through 2029. Most can be cancelled with 90 days’ notice. That is a multi-year contractual ceiling, not booked revenue or an irrevocable order. It puts a named customer beside SpaceX’s build, but the cancellation terms leave the timing risk with the infrastructure. Nor is the $84.5B ceiling comparable to Bloomberg’s $25B of global AI sales excluding China in Q1 2026: one is a maximum over several years; the other is one quarter of reported sales.
The financing record moved with it. The Financial Times reported early Nvidia talks with insurers about protecting lenders against neocloud defaults. Separately, The Information reported GMI Cloud raised $668M: $223M in equity with Nvidia participating, alongside $445M in credit. That credit is about twice the equity in the same raise, derived from the reported figures. Neither report measures token sales. Both show who must bear the risk while customers’ usage catches up with financing dates.
There is another proposed raise, and one observed use of chips. The Wall Street Journal reported, citing sources, that Nvidia-backed Lambda is raising up to $4B at a $14.5B pre-money valuation before a planned IPO. That is proposed equity financing, not token revenue. The Information reported that SpaceX’s AI unit held talks about leasing compute to Microsoft; talks are not a signed lease. Mistral said it trained ML4 from scratch on 3,800 Nvidia Grace Blackwell GPUs in its European data centres. The Deep View reported 4,000 for that training, 200 more than Mistral’s own count. The training run establishes chip use, not a realised price per token or utilisation of Barclays’ announced 46GW.
The product route is less settled than the August Salesforce–Anthropic partnership made it look. SiliconANGLE reported that Salesforce announced Koa in September, a CRM reasoning model built on Nvidia’s Nemotron architecture for Agentforce agents. Salesforce now has a model path inside Agentforce as well as workflows served inside Claude. Neither announcement discloses realised revenue per task. The Information’s August 31 report said providers were testing outcome-based pricing; testing is not a disclosed price or margin.
CNBC reported on September 3 that Nvidia agreed to buy Hugging Face for $12.9B, against $20B paid for Groq assets in December 2025. CNBC’s September 29 account of earlier talks said OpenAI had offered roughly $100M before the acquisition and that AMD and Salesforce also held talks. The $13B acquisition figure in that account rounds the earlier $12.9B report. Those talks establish interest in model distribution, not additional completed deals or token revenue.
OpenAI said it plans to stop supplying models to Cursor on November 12 because it could not confirm that SpaceX would comply with its terms. The cutoff was proposed. It shows that owning compute and an application does not remove model-supply dependence. The Associated Press reported that SpaceX’s September Starship orbital launch deployed 26 Starlink satellites, compared with about 11,000 already in service. That is a launch milestone, not evidence that SpaceX deployed AI gigawatts or sold more tokens.
Sources
Phrase counts are drawn from TEXXR’s archive over matched Jan 1–Aug 28 windows in each year, counting records whose headline or summary contains the phrase; the archive held 7,872 records in the 2023 window and 14,470 in 2026, which is why ratios rather than counts carry the argument. Revenue-per-user figures divide disclosed run rates by reported app audiences and are approximations across mixed reporting dates, stated as such. Article IDs resolve at texxr.com/<id>.
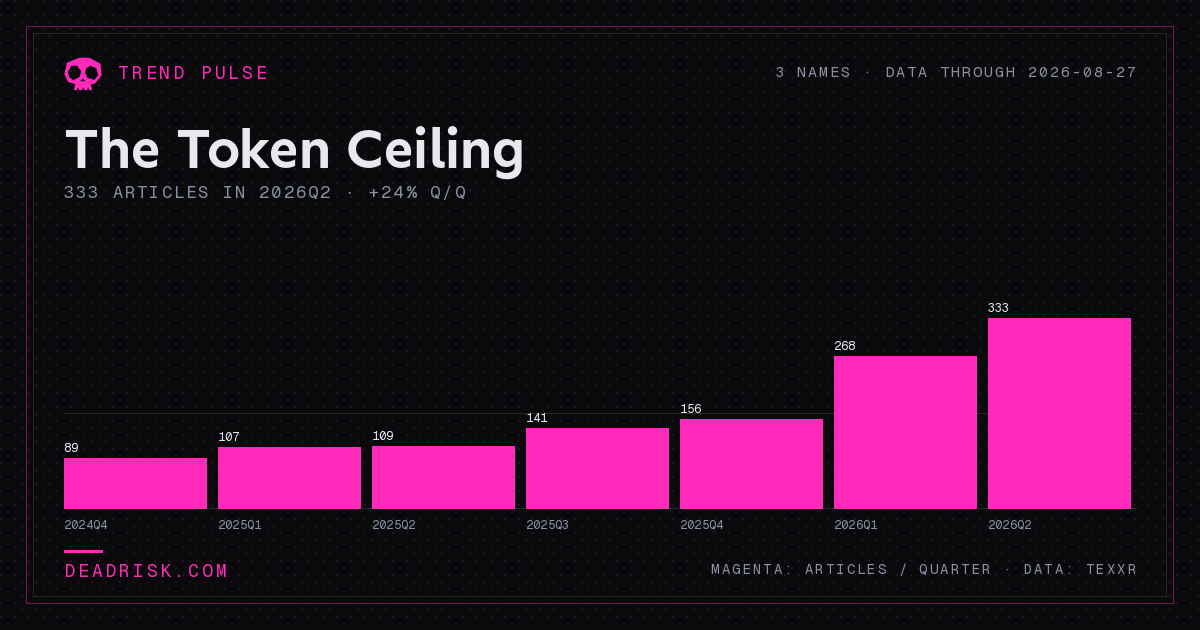
Across 3 member names, 2026Q3 drew 330 articles against 333 in 2026Q2. The largest single move was SpaceX, -52%.
Coverage data as of 2026-10-12 · the essay above was last revised 2026-10-07